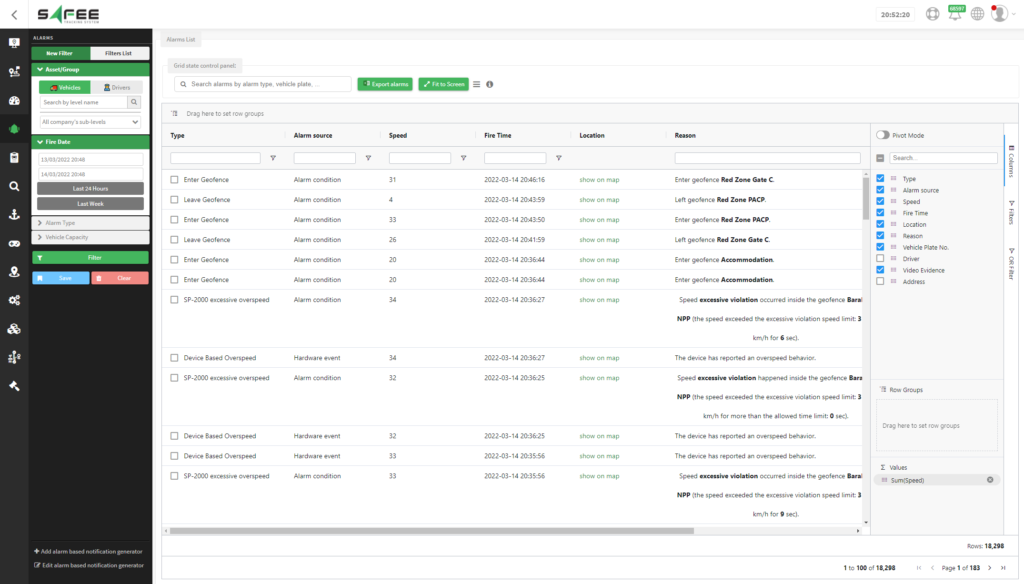
Safee New Interactive Grid Capabilities
New enhancements were added to Safee to make its user-interfaces of live updates more interactive, easier to read and interpret. Advanced data organizing and displaying capabilities that aim to boost user productivity and help interpret better the live events data of the dynamic environment of the fleet operations.
Safee development team has integrated AgGrid features with its data tables on the platform so the
fleet manager can group, aggregate, sort, and filter data, drag and drop columns, to organize the
tables of the live stream updates received directly from the GPS tracking devices installed within the
vehicles in the field.
Users can examine the new integrated features in the following parts of the platform:
- Alarms Report
- Alarms Explorer
- Vehicle Driving Dashboard
- Geofence Backtracking Report
- Geofence Based Voyage
Advanced Grid Capabilities of Safee
Web-based Interactive Data Formatting
One of the greatest advantages of Safee-AgGrid integration is that users can now treat their data and
format their tables in whatever manner they want as if it’s an excel sheet, and that will be directly on
the web interface with no need for exporting data as an Excel or CSV file to the local machines
anymore. Users can achieve tremendous results from their data by working securely only via internet
access to our cloud-based platform.
Additionally, all reports can be scheduled to be sent on a regular basis via email while maintaining the
same formates and data arrangements that have been set previously on the platform.
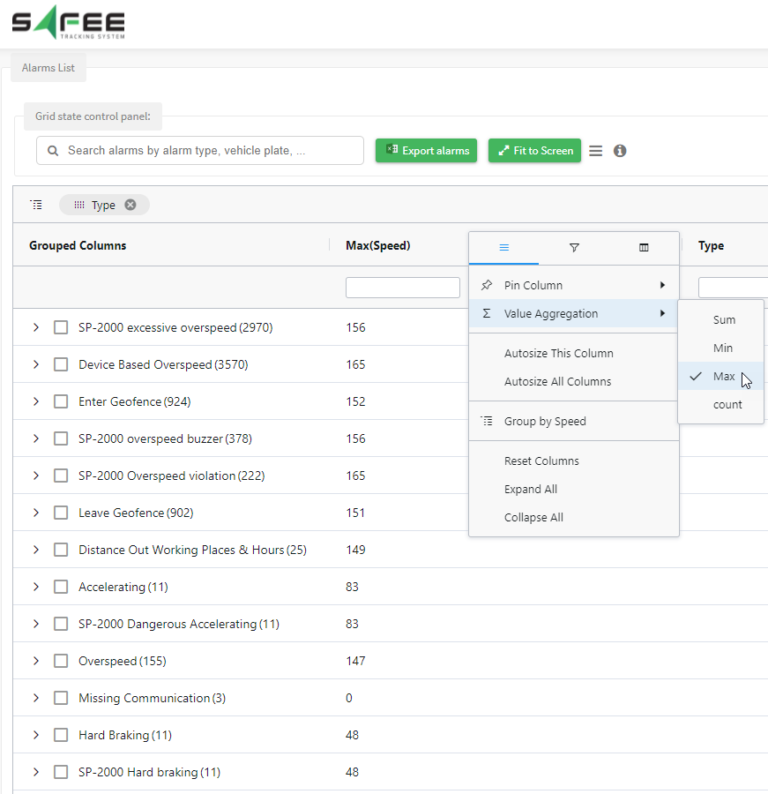
Aggregation
When you group the data in the table you can also do aggregations to the number and date values in
the tables. For numbers, the aggregation functions available are Sum, Min, Max, and Count. For date
values, there are MinDate, MaxDate, and Count functions. To make an aggregation, simply hover on
the column name, so the three lines menu icon appears, click on it and once the menu appears choose
the “value aggregation” option, then select the aggregation function you would like to apply.
Aggregations are affected by the filters you use. So, as you filter the table for specific types of data,
the aggregated values are changing accordingly to include only the values of the filtered rows.
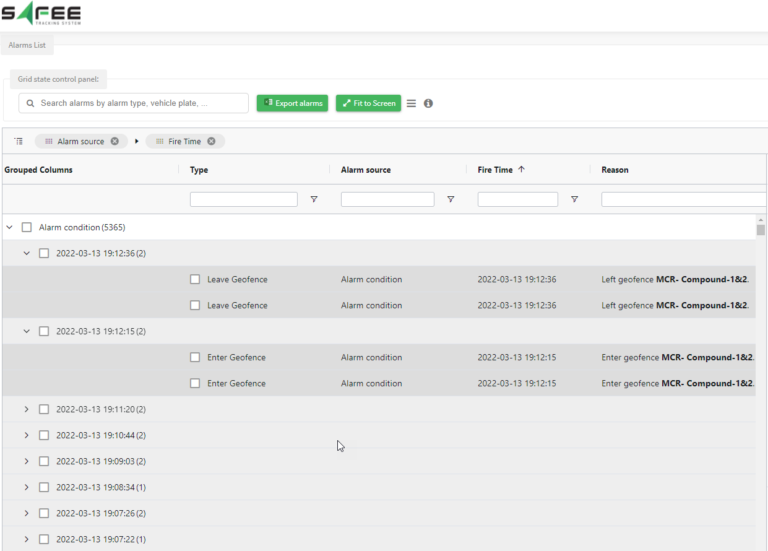
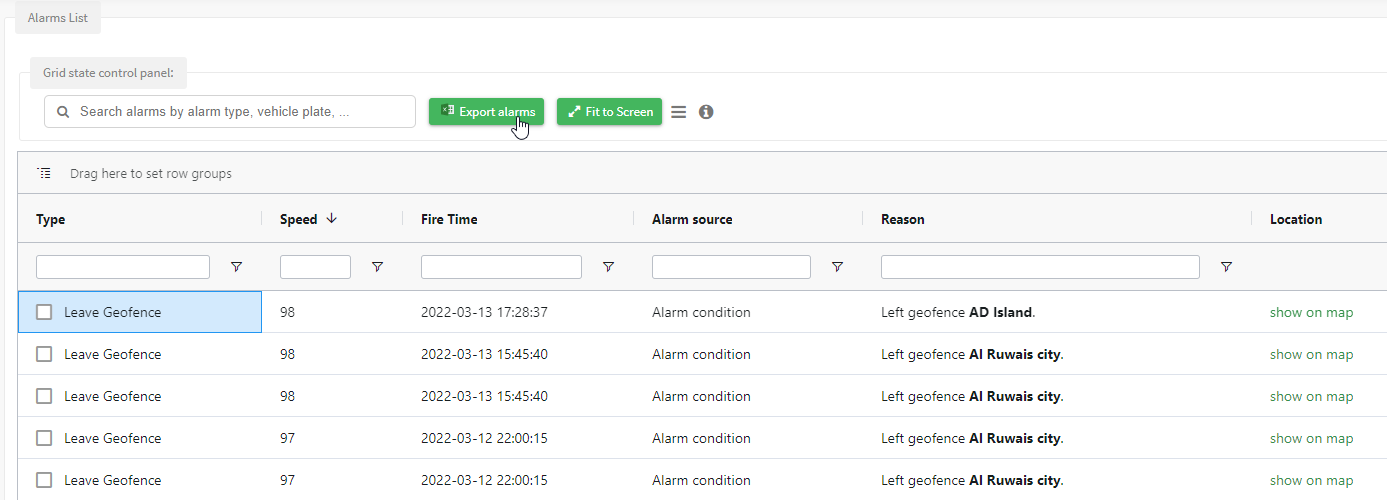
Multilevel Grouping
You can use the row grouping feature to group data over multiple selected dimensions. You can set the data to be grouped by specific columns, simply drag and drop columns of your choice in the area above the columns titles.
Range Selection
Drag the mouse pointer over multiple cells of the table to create a range selection. This is an easy way for highlighting a bunch of data for copying it to the clipboard or exporting it to an Excel or CSV file.
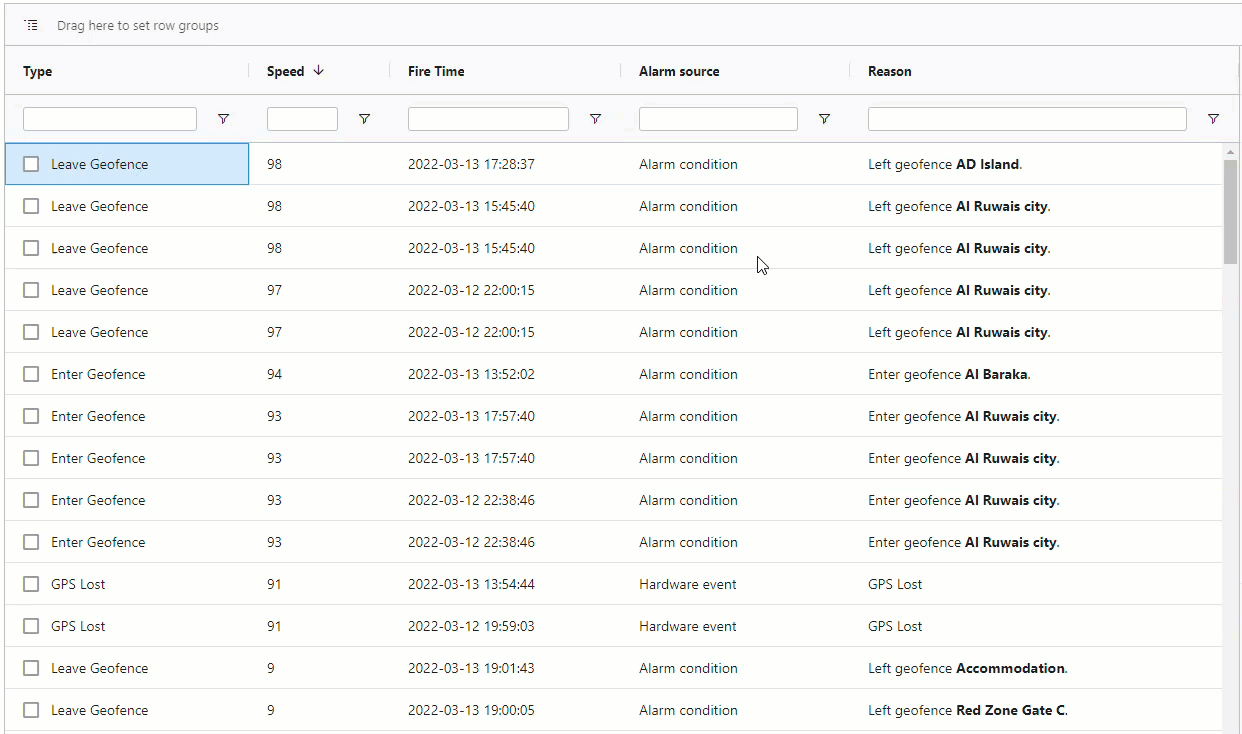
Draggable Columns
Rearrange the order of the columns while reviewing the updated data table, simply just drag the column and drop it into the place you want.
Pinned Columns
You can also pin one or more columns to the left or the right through the option available in the column menu. Pinned columns will be fixed and not affected by horizontal scroll.
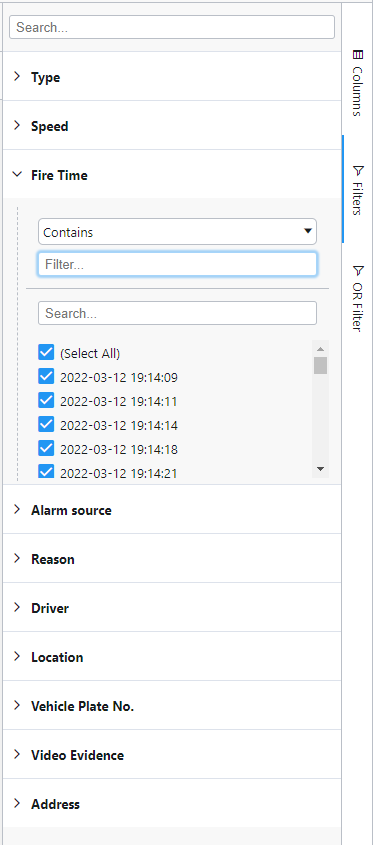
Data Filtering
There are multiple options for filtering.
- Filter In The Column Header
When you click the filter sign, a filter panel that includes two types of filtering appears:- And/Or Expression Filtering. you can specify the value, select an option such as Contains or Start With … etc, determine the expression operator and/or.
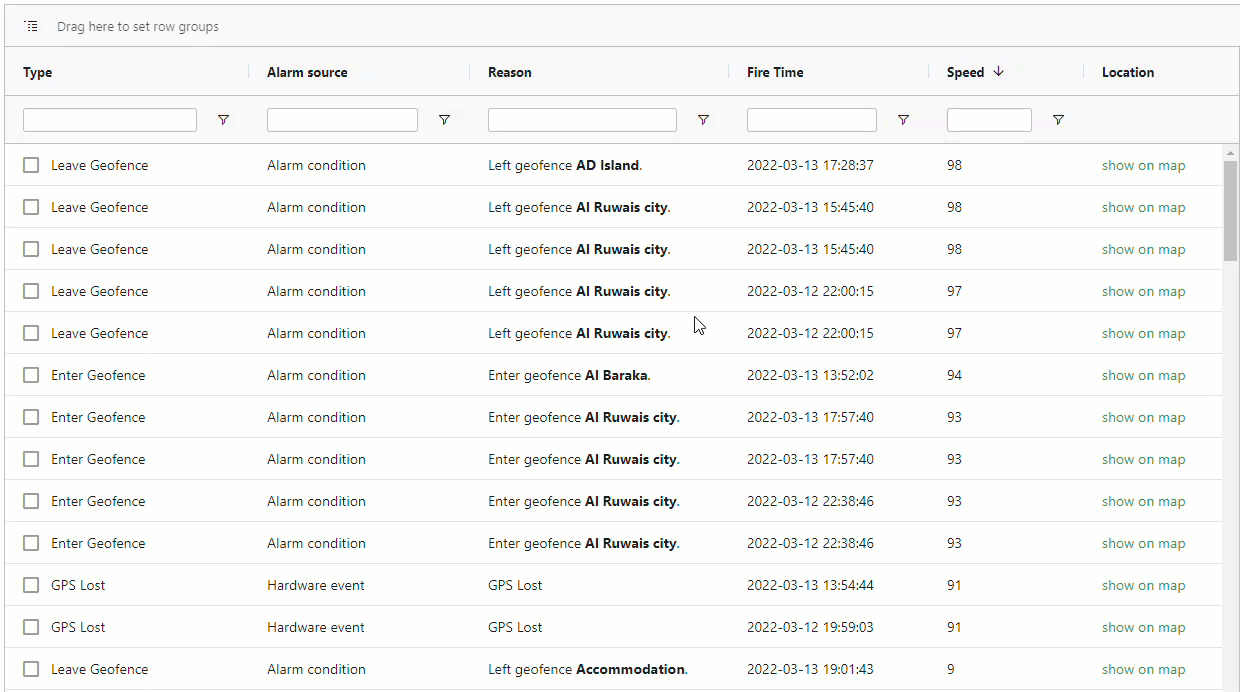
- Checkbox Filtering. this type of filter is also called Set Filter and works just like Excel, this filter on the panel shows all distinct values of the column with a checkbox for each value. You can include or exclude any of these distinct values, just by checking or unchecking the boxes.
- And/Or Expression Filtering. you can specify the value, select an option such as Contains or Start With … etc, determine the expression operator and/or.
- Quick Text Search Filter
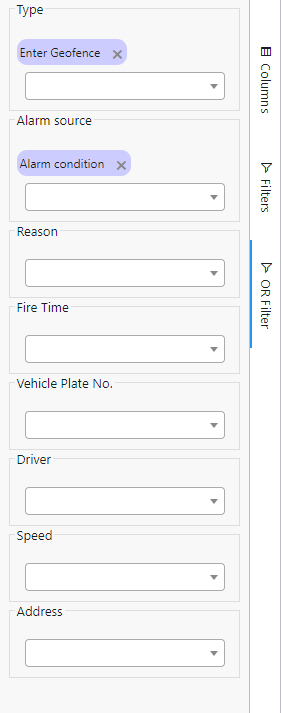
This filter is applied to all columns simultaneously with a simple text search. Use the quick filter above the data table, enter your filtering search words into the text area to search and filter data in all columns. Press the Enter button after you put the search word. - Sidebar OR Filter
For each column of the data table, there is a drop-down menu for all the distinct values in this column. Choosing a value of this drop-down menu will generate a filter condition. The final filter expression will be an “OR” logic expression between all these filter conditions.
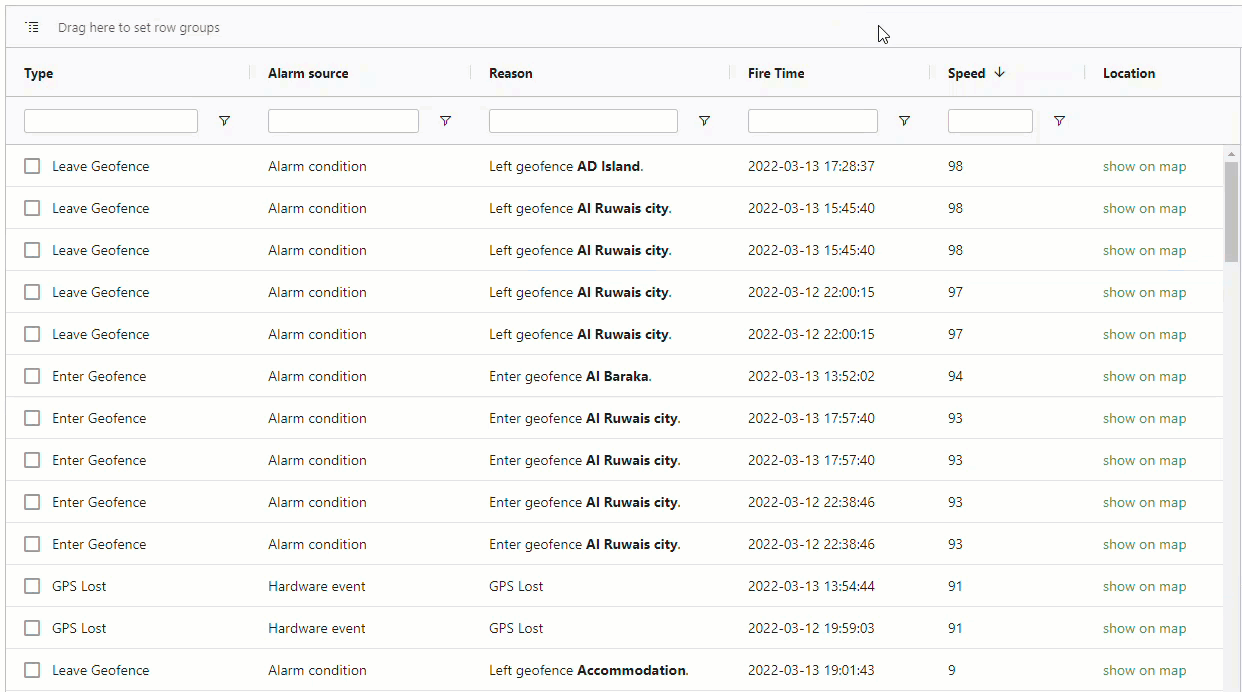
Data Sorting
Click on the header column to enable ascending sorting, click again to enable descending sorting, click one more time to disable sorting and to get back to the default order of the column values.
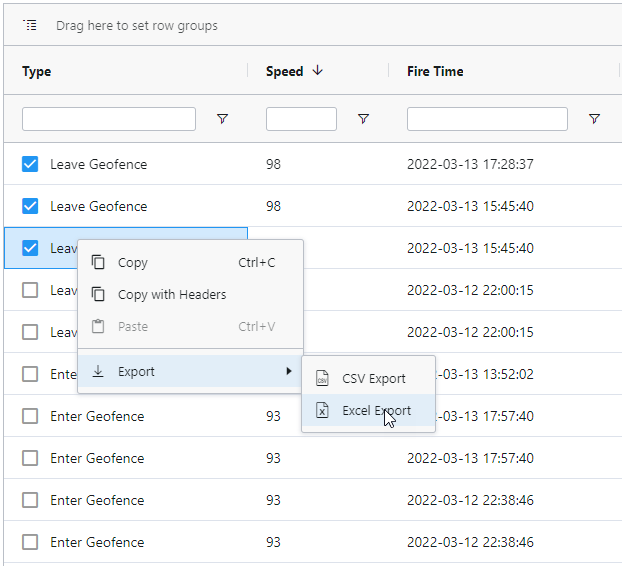
Data Exporting
Exporting option in native Excel format that maintains the column widths and styles. There are two ways to export data from the tables:
- Click on the export button above the table to export all the data.
- Select a set of records via their checkboxes, right-click and choose the export option.
Sidebar Options
- Columns Panel
Where you can hide or show any column via the checkboxes in front of each column name. There are also sections for data grouping and aggregations.
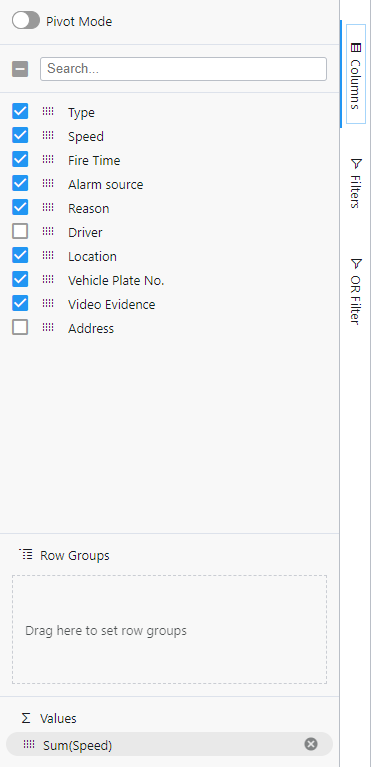
- Filters Panel
Where you can access column filters through this panel. - OR Filter Panel
Where you can generate a customized “OR” filtering expression. For example, you might choose value x from column A and value y from column B. The filtering result will include all the records that satisfy the first condition or the second condition.